Understanding your dashboard
In short: The dashboard is the home screen you land on after signing in, summarising your fundraising for a chosen date range. The full dashboard with charts and snapshots is shown to users with the View Reports permission; others see a simpler welcome screen. You must have finished the onboarding wizard and setup checklist to reach it.
Overview
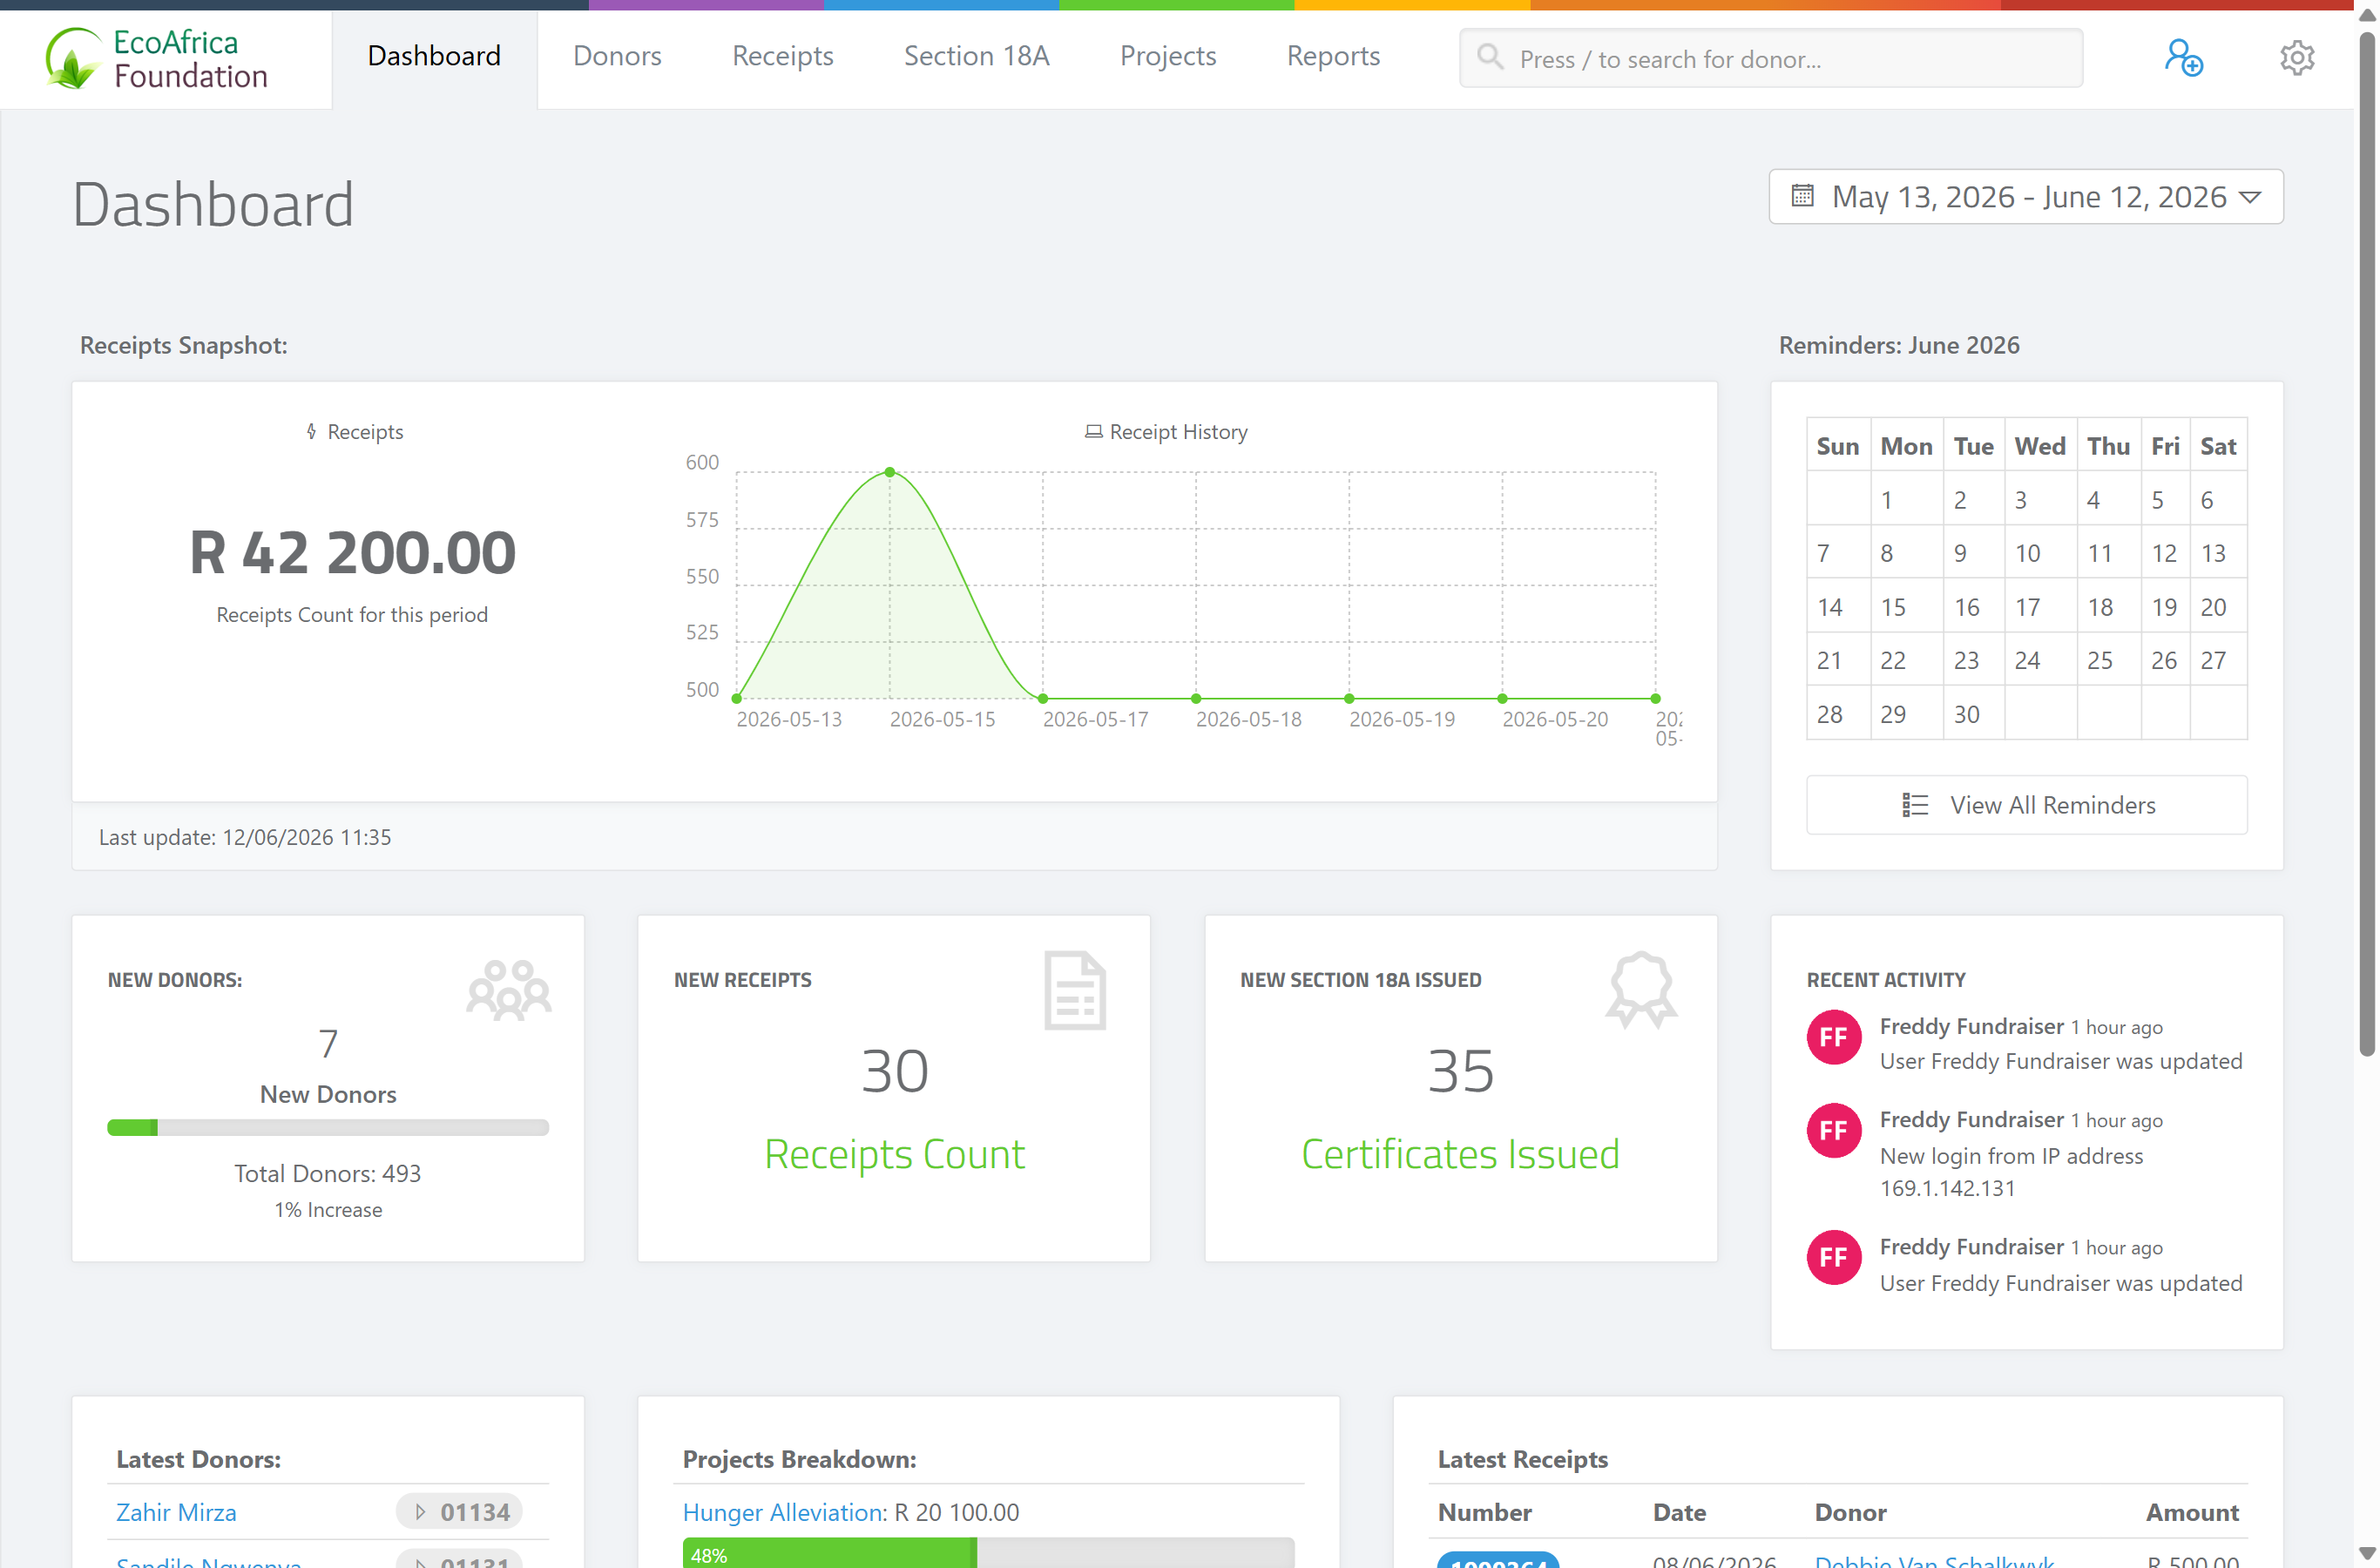
The dashboard gives you an at-a-glance summary of your fundraising for a chosen date range: receipt totals, new donors, receipts issued, Section 18A certificates issued, upcoming reminders, recent activity, and your latest donors, projects and receipts. It lives at the root address (/) of your charity's workspace and is labelled Dashboard in the top navigation bar.
Before you start
You'll need:
- The onboarding wizard and setup checklist completed. While your checklist is unfinished, the dashboard address shows the setup checklist instead — see Using the setup checklist.
- The View Reports permission to see the full dashboard with charts and snapshots. Without it you see a simpler welcome screen (described below).
What's on the dashboard
For users with View Reports, the dashboard shows:
- Date range picker — top right, next to the "Dashboard" heading. It controls the period for the figures on the page. The default range is the last 30 days.
- Receipts Snapshot — the total value and a history chart of receipts for the selected period, with a "Last update" timestamp.
- Reminders — a calendar for the current month highlighting days that have donor reminders due, with a View All Reminders button. Past days with reminders are flagged in red; today is highlighted.
- New Donors — the number of new donors in the period, total donor count, and a percentage-increase indicator.
- New Receipts — the count of receipts created in the period.
- New Section 18A Issued — the number of Section 18A certificates issued in the period.
- Recent Activity — the three most recent activity-log entries, with who performed each action.
- Latest Donors, Projects Breakdown (top projects by amount raised, with progress bars) and Latest Receipts (receipt number, date, donor and amount).
If you do not have View Reports, the dashboard instead shows a "Welcome back" panel with quick Add Donor and Add Receipt buttons (each shown only if you have the matching permission).
Choosing the date range
Step 1: Open the date range control
Select the date range control at the top right of the dashboard (it shows the current period next to a calendar icon).
Step 2: Pick a period
Pick a preset range or a custom start and end date. Presets include: Today, Yesterday, Last 7 Days, Last 30 Days, This Month, Last Month, Last 3 Months, and Year to Date.
The Year to Date preset runs from your organisation's financial-year start date, set under Organisation settings (it defaults to 1 March if not configured).
Step 3: Apply
When you apply a range, the dashboard reloads and all the snapshot figures update to that period.
💡 Tip: Your chosen range is remembered for the rest of your session, so the dashboard keeps showing the same period as you move around and come back.
The first-run welcome screen
When your workspace still has only the single placeholder donor that was created at sign-up, the dashboard shows a welcome panel instead of the snapshots:
- If you haven't yet added a project, it prompts "Lets begin by adding a project we wish to raise funds for…" with an Add a Project button.
- Once you have a project, it prompts "Now lets add our first donor:" with an Add a Donor button.
This panel disappears once you have real donor data, and the full dashboard appears.
A note on mobile
ActiveDonor online is designed for desktop use. On a phone, the dashboard shows a note that the web app "works best on desktop devices" and links to the ActiveDonor Android app on Google Play.
What this does not do
- It does not show charts and snapshots to users without View Reports — they get the welcome panel with quick-add buttons.
- The figures are scoped to the chosen date range, not all-time, except where a card explicitly shows a running total (such as total donor count).
- It is not the full reporting area — for analytical reports see The Reports dashboard.
Common issues & solutions
| What you see | What it means | How to fix it |
|---|---|---|
| The dashboard shows the setup checklist instead of snapshots. | Your setup checklist isn't complete. | Finish the required steps — see Using the setup checklist. |
| You see a "Welcome back" panel with only Add Donor / Add Receipt buttons. | You don't have the View Reports permission. | Ask an administrator to grant View Reports — see Roles and permissions. |
| Snapshot figures look wrong / too low. | The date range is narrower than you expect. | Open the date-range picker and select a wider preset such as Last 30 Days or Year to Date. |
FAQ
Why don't I see any charts on my dashboard? You likely don't have the View Reports permission, so you see the welcome panel instead. An administrator can grant it (see Roles and permissions).
How do I change the period the dashboard covers? Use the date-range picker at the top right. The default is the last 30 days; your choice is remembered for the session.
What does "Year to Date" use as its start? Your organisation's financial-year start date (set in Organisation settings), defaulting to 1 March if not configured.
Why is the dashboard showing the setup checklist? Your setup checklist isn't finished yet. Complete the required steps and the normal dashboard takes over — see Using the setup checklist.
Related
- Using the setup checklist
- Completing the onboarding wizard
- Setting reminders for a donor
- The Reports dashboard
- Organisation settings
- Roles and permissions
- Audit log
Need a hand?
If your dashboard figures don't match what you expect even after widening the date range, contact ActiveDonor support with the period you're looking at and what you expected to see.